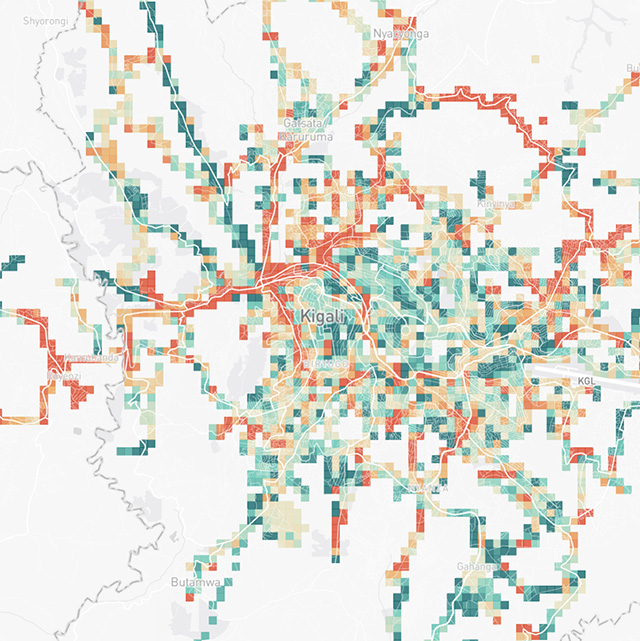
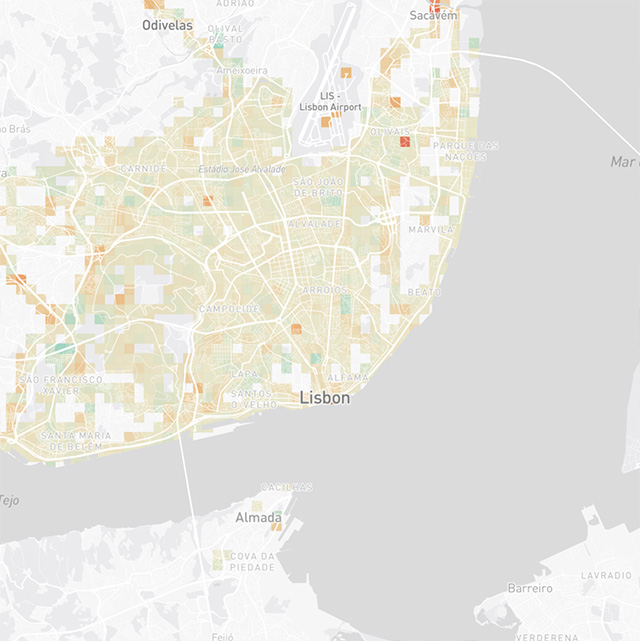
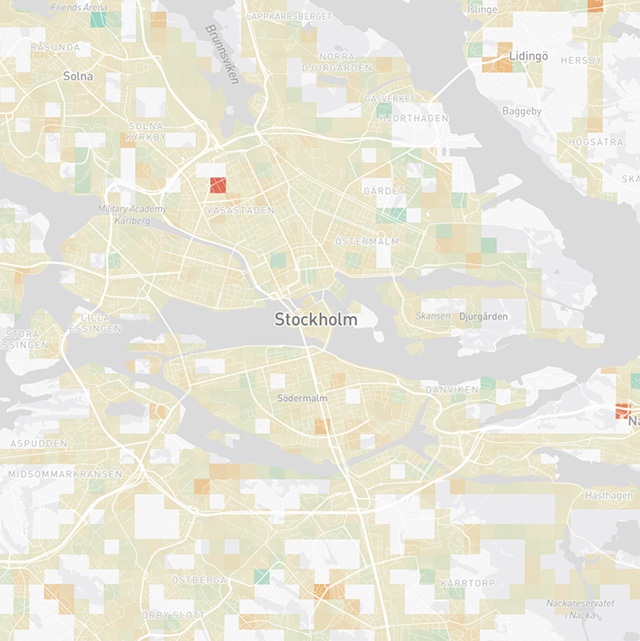
air quality maps
Here you can find some examples of open-seneca air quality maps, obtained as a result of deploying a network of open-seneca mobile sensors with the help of citizen science.
These maps are a powerful tool to understand spatial and temporal variations of PM2.5 in a city and inform evidence-based solutions.
Click on one of the cities to view their air quality map!
END OF FUNDING! Apply for our remaining stock!Frequently asked questions
In order to know how to read these maps and interpret the information they contain, make sure you read our FAQs.
© 2018 - 2025 open-seneca. All rights reserved.


